Since 2019, VineForecast has been helping wineries to reduce the risk of crop loss due to fungal infections or weather risks and to optimize the spraying schedule. The system calculates disease and weather forecasts and does not require weather stations. Instead, an artificial intelligence calculates microclimate and disease forecasts with a resolution of 25 m x 25 m.
We have been using VineForecast's weather and disease forecasts since 2020, and in recent years I have been very pleased and have been able to save an average of 1-2 sprays per season.
Sebastian Schneider, Winery Sebastian Schneider
Our goal is a responsible and realistic reduction of crop protection to the necessary minimum. Especially in times of the Farm-to-Fork Strategy ("Green Deal") or pesticide bans, we want to give as many farms as possible access to the latest developments in research and technology. Until today, however, users first had to register to gain access to VineForecast's infection forecasts.
The VitiMap - Quick and clear disease forecasts
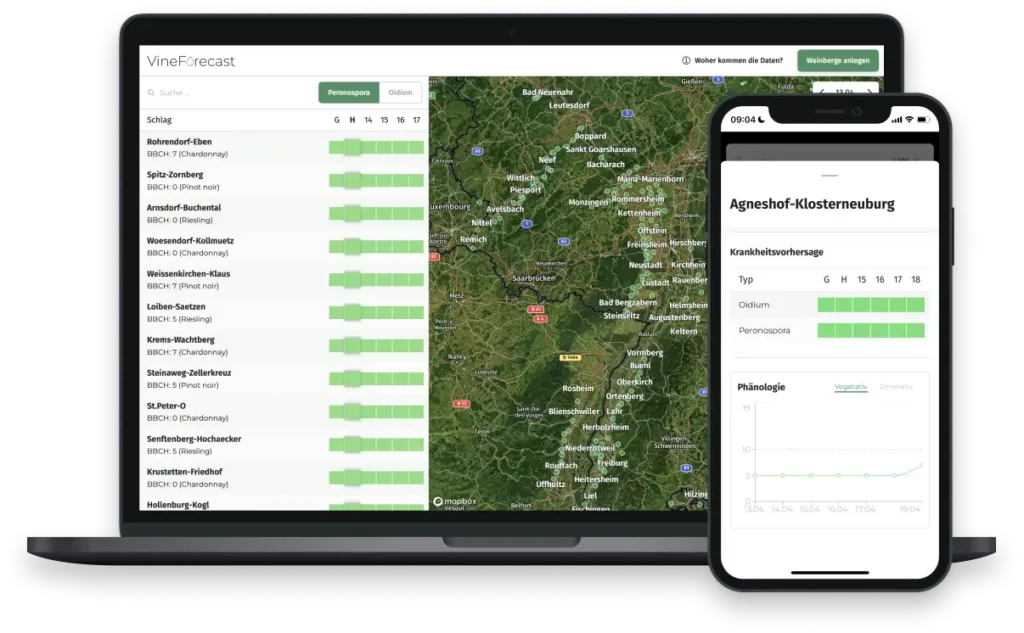
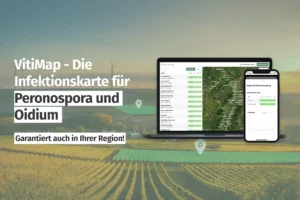
As of now, winegrowers can obtain a freely accessible overview of infection pressure at over 360 different locations.
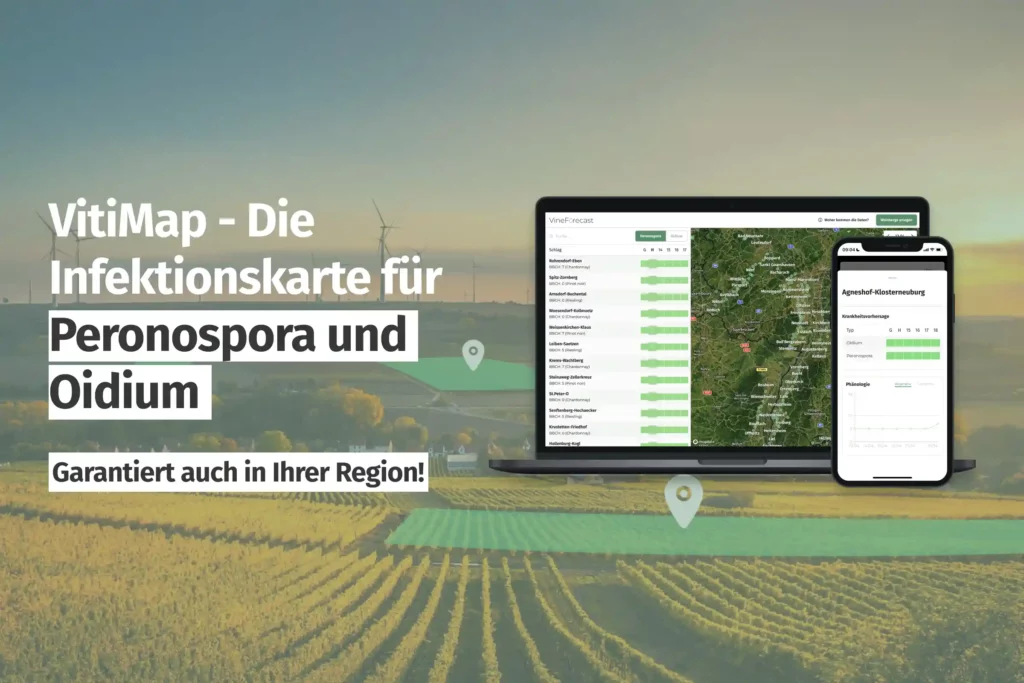
VitiMap is a forecast map for Downy and Powdery mildew based on the VineForecast forecasting system. The practical app can be accessed via any internet browser and is also optimized for mobile phones.
The system is already running in all growing regions in Germany and Austria. In addition, various sites are operated in France, Belgium, and Luxembourg.
The contents of the VitiMap
In the first version, winemakers will find the following data:
- Downy mildew forecasts (four days + one-day retrospective).
- Powdery mildew forecasts (four days + one-day retrospective).
- BBCH stage
- Leaf surface
- Various grape variety models
The VitiMap contains a clear map view as well as a detailed view per vineyard. The infection risks are indicated in the traffic light colors green (low), yellow (medium), and red (high).
Get an impression of the VitiMap and contact us via the support chat to submit suggestions for improvement or location requests. If you would like to get detailed forecasts for the areas of your vineyards, you can also register with VineForecast and test all functions free of charge for 30 days.
