VineForecast creates forecasts for every vineyard without installing weather stations. In this blog article, you will learn how this works and on which methodology the technology behind it is based.
Downscaling of weather forecast
To understand how weather forecasts are created, we first need to delve a bit into the matter. Now and then, it is assumed that the nearest weather stations provide the weather forecast for the region. In reality, however, complex weather models are behind the weather forecast.
The forecasts are calculated several times a day on supercomputers by national and international weather services such as the German Weather Service (DWD). Here, the development of the weather pattern in the coming hours and days is calculated using a weather model.
Measured values serve as a starting point for weather forecasts
Somewhat simplified, in a weather model, the earth is divided into so-called grid boxes. This can be imagined like a checkerboard pattern. Each box of the checkerboard can be assigned a value for temperature, air pressure, or humidity. Based on physical laws, it is then calculated how the various values develop over time. The smaller these grid boxes are, the higher the resolution of the weather model, and the more realistically the influence of regional conditions, such as topography, can be represented.
For each grid box, an averaged topography is used. This means that topographic details disappear in models with a lower resolution. This difference can be seen in Figure 1. The upper image shows the topography of the Alps for a resolution of about 6km x 6km, while the lower image shows a resolution of 2km x 2km.
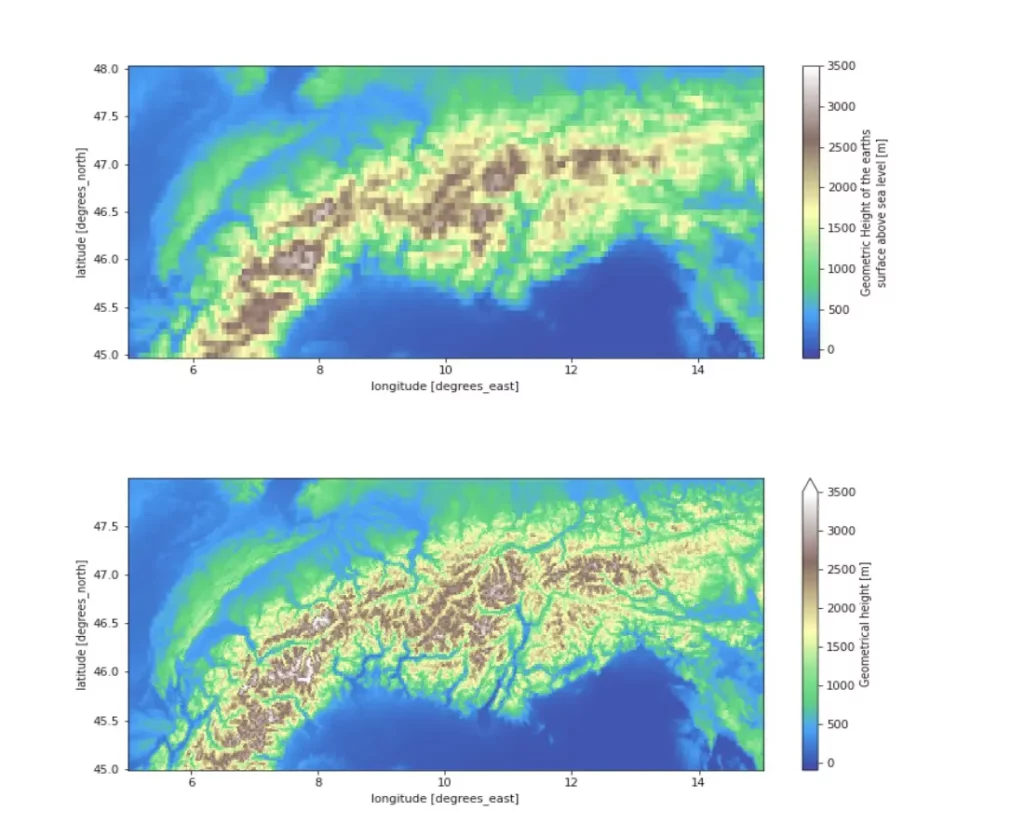
Fig. 1: Two topography models juxtaposed: Above a resolution of 6km x 6km, below 2km x 2km.
Before a weather model can be started, each grid box ("each field of the chessboard") must be "filled" with initial values. For the initial values of the calculations, a variety of measurement data from weather stations, weather balloons, airplanes, or satellite data flow into the model.
The resolution of the weather models is crucial
However, the higher the resolution of a weather model, the more computing capacity is required. Therefore, most weather models currently have a horizontal resolution of 1km x 1km at best. For medium-term forecasts, which go several days into the future, the resolution is often significantly lower. For example, the DWD's ICON-EU model has a resolution of about 6km x 6km and extends up to 180 hours into the future. The higher resolution ICON-D2 model has a resolution of about 2km x 2km but extends only 48 hours into the future.
To estimate the general development of the weather in the coming days, this resolution is often perfectly sufficient. It becomes problematic when one is interested in the specific microclimate at a location. Since the forecast values from the weather models represent rather averaged values over a grid box, these can sometimes deviate significantly from the actual values at a specific coordinate. This issue is particularly pronounced when the forecast point is located in a region with complex topography.
Downscaling of weather data
To correct these errors in the forecast, meteorology and climate physics use the technique of downscaling. Statistical correlations between topography and microclimate are used to better calibrate the weather forecast to the local topography. Downscaling gains particular importance for all processes where small differences can have large effects. In viticulture, for example, a 2-3 hours difference in leaf wetness duration can already have a strong impact on the infection risk for downy mildew. Therefore, VineForecast weather forecasts are first regionalized before being used in disease modeling.
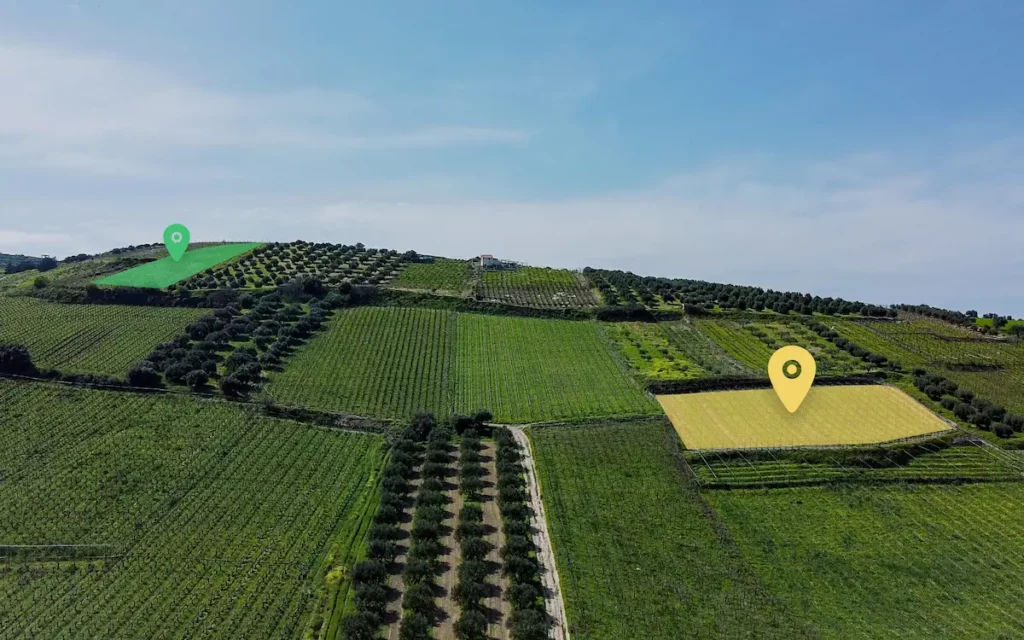
An example of the downscaling of temperature at 2 meters is shown in Figure 2 below. On the left is the standard weather forecast of the ICON-D2 model of the DWD (2km x 2km resolution) while on the right is the regionalized forecast of VineForecast (25m x 25m resolution). By the way, in the southeast of the map is the Mosel valley, which is clearly visible in the regionalized forecast.
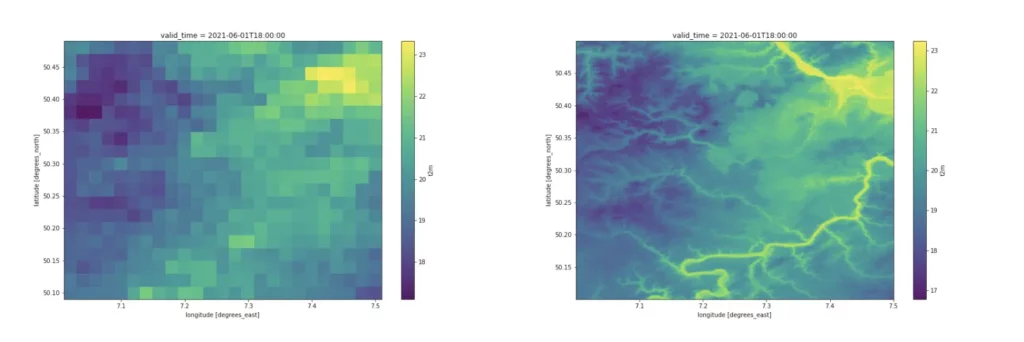
Fig. 2: Regionalised temperature: on the left a resolution of 2km x 2km, on the right 25m x 25m
Downscaling of disease projections
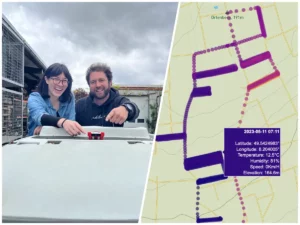
Let's now take a look at how downscaling affects disease forecasts. For this purpose, we compare the infection forecasts for secondary infections with downy mildew between the standard weather forecast and the regionalized weather forecast in the example for 11 June 2021 for the region around Cochem at Moselle.
Usually, the daily sum of the variable "degree hours at leaf wetness" is used as a measure of the risk of infection with downy mildew. This variable is calculated from the hourly values of temperature and leaf wetness, adding up all those temperature values over a day for which leaf wetness was present at the same time (see also here). If the daily sum rises above a value of 50, a slight risk of infection is assumed. From values above 150, severe infections are to be expected.
If we now compare the disease forecast based on the standard weather forecast with the regionalized forecast in Figure 3, it becomes clear how strongly downscaling affects the disease forecast and how much the infection pressure varies over short distances. Using a non-regionalized weather forecast as the basis for disease forecasts, when in doubt, can result in disease risks being greatly under- or overestimated.
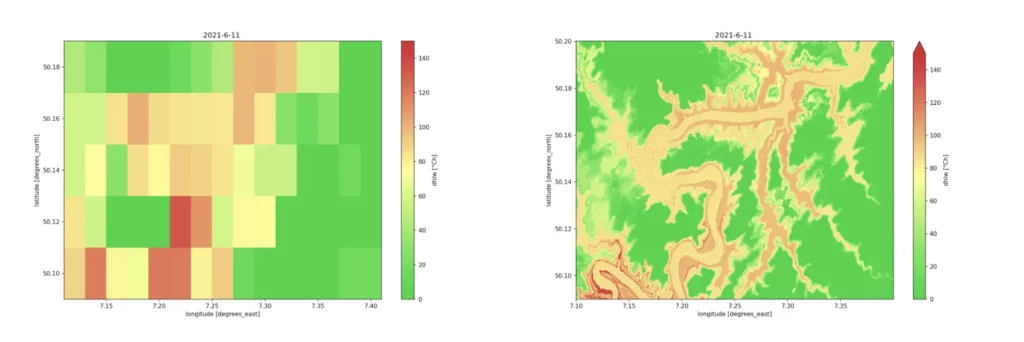
Fig. 3: Downscale disease forecasts: non-regionalized on the left, regionalized on the right.